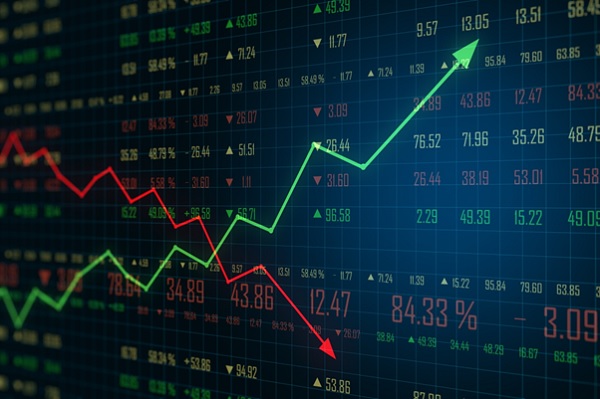
Are you looking to use price action charts to make your day trading decisions?
Trading on the price action patterns alone is an effective strategy for traders to compete in the new digital age. If you want to learn about price action and recognize trading opportunities, you need to know what to look for.
Read on to discover how to recognize different price action patterns and how to use them to your advantage when investing.
What Are Price Action Patterns
Price action patterns refer to the movement and behavior of prices in financial markets. These prices can range from stocks to currencies and commodities.
It is the study and analysis of historical price data. This helps stock traders identify recurring patterns that can help traders make informed trading decisions.
Common Price Patterns and Their Meanings
These patterns have specific meanings and can indicate trend reversals. It also shows the continuation of an existing trend or potential market volatility. Here are the most common price action patterns and what they mean.
Double Top
The double top is a bearish reversal pattern that occurs when an uptrend reaches a resistance level twice but fails to break through. It forms two distinct peaks at the same level. Traders see this as a sign of weakness in the market.
The price has failed to make a new high and is likely to reverse downwards. This pattern is often accompanied by a decrease in trading volume. This further signals the loss of momentum.
Double Bottom
A double bottom pattern is characterized by two consecutive lows at a similar price level, with a peak in between. This pattern typically signals a potential reversal of a downtrend. Traders often look for confirmation of the pattern. They look at an increase in volume or a bullish candlestick, to further validate the potential reversal.
Head and Shoulders
The head and shoulders pattern consists of two smaller peaks, known as the “shoulders”, on either side of a higher peak, known as the “head”. This forms a distinct visual pattern resembling a human head and shoulders. The head and shoulders pattern is considered a bearish reversal pattern. This means it signals a potential trend change from bullish to bearish.
Flag Patterns
Flag pattern patterns are characterized by a sharp up or down movement in stock charts. It is then followed by a consolidation, creating a “flag” shape. Flag patterns can be found in all markets and timeframes. Traders often use support and resistance levels to identify potential flag patterns and plan their entries and exits accordingly.
How Price Action Patterns Predict Market Movements
By understanding and recognizing stock trends, traders can make more informed trading decisions and predict possible market movements. This can be especially useful in volatile market conditions where traditional technical indicators may not be as reliable.
Price action patterns help traders analyze market psychology and make more accurate predictions. This leads to better trading outcomes. If you want to learn more about how to use these patterns or even get a better trading experience, check out this blog about day trading signals.
Develop an Effective Trading Strategy Today
Understanding stock price predictions is crucial for any trader looking to analyze market trends and make informed decisions. By familiarizing yourself with common price action patterns and their implications, you can develop a more effective trading strategy.
So if you want to improve your trading skills, start studying price action patterns today. Happy trading!